The Original Manifesto for Information Visualization and Pictorial Statistics: ISOTYPE Creator Otto Neurath’s Pioneering 1930 Visual Language
By Maria Popova
“Finding the words is another step in learning to see,” bryologist Robin Wall Kimmerer wrote in her lyrical love letter to moss — a poetic reminder that the history of science, which is the history of the human effort to fully see reality and describe what we see, rests upon foundations of linguistic description, from Galileo’s historic discovery and naming of Jupiter’s moons to Linnaean taxonomy and the classification system that gave the clouds their names to Werner’s pioneering nomenclature of color that inspired Darwin.
But what if shedding the words is a step in learning to see better, to apprehend more clearly?
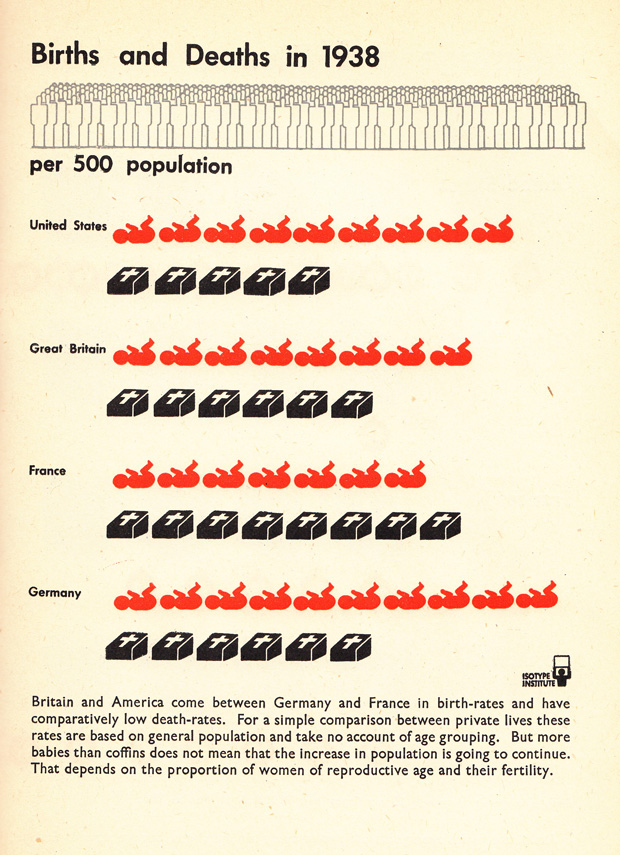
Nearly a century before infographics and data visualization became the cultural ubiquity they are today, the pioneering Austrian sociologist, philosopher of science, social reformer, and curator Otto Neurath (December 10, 1882–December 22, 1945), together with his not-yet-wife Marie, invented ISOTYPE — the visionary pictogram language that furnished the vocabulary of modern infographics.

Several years earlier, Neurath had co-founded the Vienna Circle — the materialist parish of paradox that shaped the intellectual life of the twentieth century by introducing the philosophical movement known as logical positivism. While the Circle grew preoccupied with debating, almost to the point of rupture, the writings of Ludwig Wittgenstein and his pictorial theory of language — “A proposition states something only insofar as it is a picture,” Wittgenstein proclaimed — Neurath set out to bypass language altogether and devise a system of communication based entirely on icons. But, invariably and rather ironically, he fell back on language, writing a series of slogans — words at their most pointed — to convey the urgency and necessity of this new visual language:
Words divide, pictures unite!
Whatever can be shown by a picture must not be told in words.
Remembering simplified pictures is better than forgetting exact numbers.
Whoever leaves the most out is the best teacher.


Anticipating Oxford economist Kate Raworth devised her visionary “donut economics” model of a more sustainable, equitable, and universally beneficial global economy by a century, Neurath insisted:
A pictorial survey of the world economy is not just a scholarly representation of important facts; it is also the first step toward a planned world economy.

Still, his words about the inferiority of words stand today as the founding ethos of a new golden age of conveying information, at the apogee of which we are now living. Neurath, who figures prominently into Karl Sigmund’s excellent biography of the Vienna Circle, Exact Thinking in Demented Times: The Vienna Circle and the Epic Quest for the Foundations of Science (public library), composed what remains the original manifesto for data visualization and the visual communication of information. In 1930, he wrote:
Contemporary people receive a great deal of their information and their general education through pictures, illustrations, slides, and films… Up till now, the method of pictorial representation has been underdeveloped. Our aim is to create pictures that can be understood without words, if possible… We have to create symbols that can be “read” by all of us, just as we all can read letters, and just as experts can read musical notes. This requires the creation of a set of “hieroglyphs,” which can be used internationally.
These “hieroglyphs” became the pictograms we know today — building blocks of the visual statistics by which so much information is now communicated, and to the art-science of which entire volumes are devoted.
Complement this thoroughly marginal fragment of the altogether fascinating Exact Thinking in Demented Times with W.E.B. Du Bois’s little-known, arresting modernist data visualizations of social statistics about black life, predating Neurath by three decades, and Neurath’s polymathic German contemporary Fritz Kahn’s pioneering visual metaphors for understanding the human body, then immerse yourself in the intellectually enchanting world of the Vienna Circle as reanimated by a true literary artist in A Madman Dreams of Turing Machines.
—
Published December 10, 2018
—
https://www.themarginalian.org/2018/12/10/exact-thinking-in-demented-times-otto-neurath-isotype/
—


ABOUT
CONTACT
SUPPORT
SUBSCRIBE
Newsletter
RSS
CONNECT
Facebook
Twitter
Instagram
Tumblr